Tracking working time with Google Spreadsheets
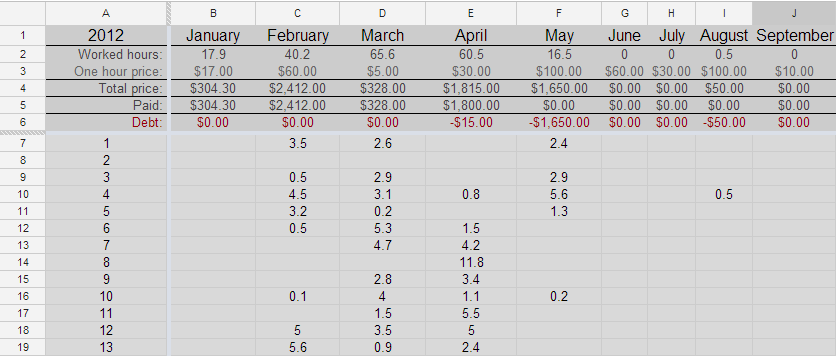
One way to get paid is by hour. I use this method for projects that need small/middle updates from time to time. There are around 10 such websites, and I have to trask time for them all. At some point, to gamificate my work, I stated to track all work in one Google Spreadsheet. For one site it is a table with months on top row, some statistical numbers in top, month dates one the left and worked hours per day on this project in middle cells:
To gain statistics for one month in one sheet is really easy.
Worked hours sum for February:
=SUM(C7:C37)
Final price for February:
=C2*C3
Debt for February:
=C5-C4
All other values are introduced by hands.
Gamification work statistics
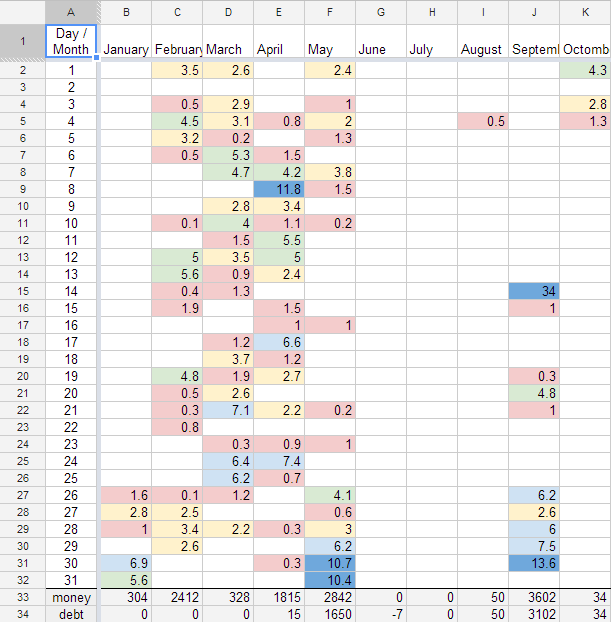
To make things more interesting, and to have overall statistics about all projects revenue and debt, I created one more sheet that was collecting all that data.
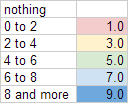
Here I used colors to visually indicate wich days were more productive, and which not.
Also on the left (second column) I put month days. Them are used by the functions which populate this sheet with data.
Populating Google Spreadsheet using provided functions
To gain statistcs from all sheets I used 2 steps:
- gain unique months
- gain statistics for each month
And here came a problem (solvable, but using long syntax). I wasn’t able to work with ranges of cells stored in different sheets as Address() inside if ArrayFormula() behaves quite not as desired. So instead of having a column of all tracked sheets, and using references to it, I had to update script each time when new sheet was added.
So instead of one-time-write this:
%% in line
=transpose(unique(transpose(arrayFormula(split(concatenate(indirect(A2:A8&"!B1:AD1") & ";")), ";"))))

%% or human readable
=transpose(
  unique(
    transpose(
      arrayFormula(
        split(
          concatenate(
            indirect(A3:A8&"!B1:AD1") & ";"
          )
        )
        , ";"
      )
    )
  )
)</code>
I came up with this formula in which I had to add manually new sheets:
=transpose(
  unique(
    transpose(
      split(
        concatenate(
            arrayFormula(Site_one!B1:Z1 & ";")
          ; arrayFormula(GreenSite!B1:Z1 & ";")
          ; arrayFormula(NiceProject.com!B1:Z1 & ";")
        )
        ; ";"
      )
    )
  )
)</code>
And this part was easy, now the script for data mine statistics:
=if(
    iferror(
        match(B$1; GreenSite.me!$B$1:$Z$1; 0)
      , FALSE
    )
  , indirect(
      address(
          $A2+6
        ; match(B$1; GreenSite.me!$B$1:$Z$1; 0)+1
        ; 1
        ; TRUE
        ; "GreenSite.me"
      )
    )
  , 0
)
+if(..
Here I had to add for each sheet its name for 3 times. And all this is done in line. Actually it may seem to be really simple, but after adding 9th project to the list, it was really motivating to automate it completely.
Populating Google Spreadsheet using Google Apps Script
After trying without success for some good time to automate everything using provided functions, I decided to use Apps Script. I knew about them, but all what I’ve done were some copy-pasting. And it was really nice when I figured out that it is based on JavaScript.
I started with given default spreadsheet script example, and after that was using spreadsheet class, sheet class, and range class documentation.
There are 3 scripts used in here. Function that hook edit events, and additionally adds button to update statistics manually:
function onOpen() {
  var sheet = SpreadsheetApp.getActiveSpreadsheet();
  var entries = [{
    name : "Update stats",
    functionName : "updateStats"
  }];
  sheet.addMenu("Stats", entries);
};

function onEdit() {
  updateStats();
}
A function that takes care about cells colors:
/*
colors:
  0   #fff
  0-2 #f4cccc
  2-4 #fff2cc
  4-6 #d9ead3
  6-8 #cfe2f3
  >8  #6fa8dc
*/
function getColor(time) {
  if(time == 0 || time === "")
    return 'white';
  else if(time < 2)
    return '#f4cccc';
  else if(time < 4)
    return '#fff2cc';
  else if(time < 6)
    return '#d9ead3';
  else if(time < 8)
    return '#cfe2f3';
  else
    return '#6fa8dc';
}
And main function that data mines, and outputs statistics.
function updateStats(){
  // get sheets with statistics
  // get statistics sheet
  var spreadsheet = SpreadsheetApp.getActiveSpreadsheet()
      , sheets = spreadsheet.getSheets()
      , sheets_stats = []
      , sheet_stats = spreadsheet.getSheetByName("_stats")
      , i
      , j
      , months = []
      ;

  for(i in sheets){
    if(sheets[i].getName().substr(0,1) != '_'){
      sheets_stats.push(sheets[i]);
    }
  }

  //=======================
  //        Months
  //=======================
  // get available months
  for(i in sheets_stats){
    var values = sheets_stats[i].getRange(1, 2, 1, sheets_stats[i].getMaxColumns()-1).getValues()[0];// get months

    for(j in values){
      if(months.indexOf(values[j]) === -1){
        months.push(values[j]);
      }
    }
  }

  // push months into stats sheet
  sheet_stats.getRange(1, 2, 1, months.length).setValues([months]);

  //=======================
  //        STATS
  //=======================
  var stats = []
      , months_dict = {};//will keep months as keys, their position as value

  // fill stats with empty values
  for(i = 0; i < 31; i++){
    stats.push([]);
    for(j in months){
      stats[i][j] = "";
    }
  }

  for(i in months){
    months_dict[months[i]] = i;
  }

  // get stats for eash cell, and populate stats sheet with this data
  for(i in sheets_stats){
    var rows = sheets_stats[i].getMaxRows() - 6
        , cols = sheets_stats[i].getMaxColumns() - 1
        , _months = sheets_stats[i].getRange(1, 2, 1, cols).getValues()[0]
        , values = sheets_stats[i].getRange(7, 2, rows, cols).getValues()
        , m
        , month_index
        , v
        , value
        , cell_value
        ;

    for(m in _months){
      month_index = months_dict[_months[m]];
      for(v = 0; v < rows; v++){         value = parseFloat(values[v][m]);         if(value > 0){
          cell_value = parseFloat(stats[v][month_index]);
          stats[v][month_index] = cell_value > 0 ? (value + cell_value) : value;
        }
      }
    }
    value;
  }

  // push stats into stats sheet
  sheet_stats.getRange(2, 2, 31, months.length).setValues(stats);

  //=======================
  //        COLORS
  //=======================
  var colors = [];

  // fill colors with white values
  for(i = 0; i < 31; i++){
    colors.push([]);
    for(j in months){
      colors[i][j] = "white";
    }
  }

  for(i = 0; i < 31; i++){
    for(j in months){
      colors[i][j] = getColor(stats[i][j]);
    }
  }

  // push stats into stats sheet
  sheet_stats.getRange(2, 2, 31, months.length).setBackgroundColors(colors);

  //=======================
  //    STATS SUMMARIES
  //=======================
  var months_money = []
      , months_money_paid = []
      , months_debt = []
      ;

  for(i in months){
    months_money.push(0);
    months_money_paid.push(0);
  }

  for(i in sheets_stats){
    var rows = sheets_stats[i].getMaxRows() - 6
        , cols = sheets_stats[i].getMaxColumns() - 1
        , _months = sheets_stats[i].getRange(1, 2, 1, cols).getValues()[0]
        , _money = sheets_stats[i].getRange(4, 2, rows, cols).getValues()[0]
        , _money_paid = sheets_stats[i].getRange(5, 2, rows, cols).getValues()[0]
        , m
        , month_index
        ;

    for(m in _months){
      month_index = months_dict[_months[m]];
      months_money[month_index] += _money[m];
      months_money_paid[month_index] += _money_paid[m];
    }
  }

  for(i in months_money){
    // round values
    months_money[i] = Math.round(months_money[i]);
    months_money_paid[i] = Math.round(months_money_paid[i]);
    // get debt
    months_debt[i] = months_money[i] - months_money_paid[i];
  }

  // push stats summaries into stats sheet
  sheet_stats.getRange(33, 2, 1, months.length).setValues([months_money]);
  sheet_stats.getRange(34, 2, 1, months.length).setValues([months_debt]);
}
Live demo can be found here. All the data in there is fake.
Set-up this script in your spreadsheet
- Create a Google Spreadsheet
- Rename default sheet to _stats
- Fill first column with dates (31 + first cell is title)
- Add scripts( Tools - Script Editor and paste functions provided previously)
Now you have to take in account that sheets which have underscore (_) as first character in name won’t be tracked.
Add one by one sheets for each project that you want to track:
- Rename new sheet to something SMART
- First row starting with second cell should be filled with months
- Next 2 rows are Worked Hours and One Hour Price
- Next 3 rows are Total Price, Paid and Debt
- In next 31 rows you'll write day by day you progress
You can track you time using many smart apps, but I use simple in-browser timer.


